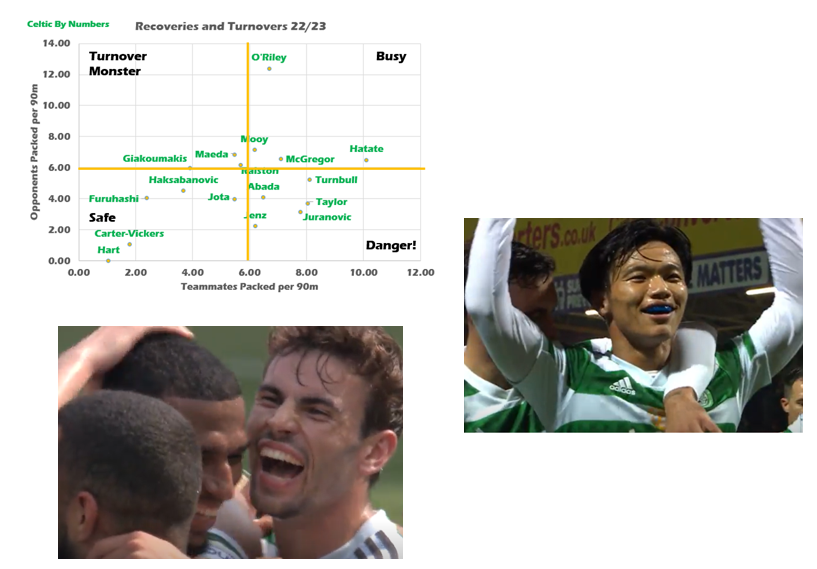
An aspect of packing I had not captured until this season concerns turnovers and recoveries.
“What does all that jargon mean?” comes the plaintive cry.
Let me unpack it. (Lol – I’m here all week.)
Definitions
Packing is the count and assignment of a value to score the taking out of opposition players with forward passes or runs and receptions of the ball.
This concept can be extended to turnovers and recoveries.
A pack turnover is when a player loses possession and in doing so, one or more of his teammates are now on the “wrong” side of the ball – i.e. out of the game.
A pack recovery is when a player recovers a loose ball from the opposition such that the opponent has players “wrong” side and are now out of the game.
I would imagine this would be, primarily, a data point useful for holding midfielders, but can obviously be used as a comparator for all positions.
I’d expect forwards to, net, turnover way more than they recover. I’d expect defenders to recover way more than they turnover.
As I have not collected this data before, I do not have a benchmark and no commercial data provider offers this data. Hint: it is quite manual and time-consuming to collect. Woe is me. You can thank me in cyber pints!
A New Benchmark
Finally, the data!

The axis represents the number of players taken out / left behind per 90 minutes on average.
I’ve attempted to classify the segments, but given this is the first effort, this may be way out.
In turn then:
- Turnover Monster – a player who forces the recovers the ball packing opponents but rarely turns the ball over himself. None directly resemble this moniker although Giorgios Giakoumakis is the one who sneaks in with around six opponents packed versus four of his own teammates so is “positive” over the 90 minutes.
- Busy – players who generate a lot of turnovers and recoveries – the central midfielders are in here.
- Safe – players who don’t turnover the ball much but also there aren’t many recoveries – goalkeepers and strikers in here and you’re more circumspect defenders.
- Danger! – players who turn over the ball a lot – the risk takers (and/or the careless!).
I think I am ok with the concepts and it will be a useful starting point for a benchmark.
A New Benchmark – The Return of a Simpler Difference Counter (these Star Wars prequels are getting tortuous)
Here is another attempt to represent the data.
Simply, this is the difference between recoveries and turnovers to see who is, net, taking the most opponents out of the game by these methods.

Which ever way you slice it, Matt O’Riley is really good at wining the ball back from opponents, whilst also losing it a fair bit due to his aggressive passing. But, overall, he takes out around five opponents more than he abandons his teammates!
Both Giakoumakis and Kyogo Furuhashi’s front-pressing skills show up well as does Daizan Maeda’s – unsurprisingly.
There are more players who put their own players out the game to a greater extent than they take the opponents out.
Perhaps this is not surprising given Celtic dominate possession and their playing style is to pass aggressively through the lines, usually against a deep and low defence.
I would probably be less concerned at Greg Taylor and Josip Juranovic having such a negative overall balance given they are usually attacking in their passing and forward runs. I’d be more concerned with Mortiz Jenz as, although he is next to a more “safe” passer in Cameron Carter-Vickers, I would not expect my central defenders to be putting his own teammates out the game with his passing.
There are a lot of nuances here in terms of settling on an interpretation of what “good” and “bad” look like for these metrics.
Here is where we stand today and I will report back when we have more data!

Watching the World Cup it has been evident that the elite players are largely that little bit quicker, in thought but also physically.
Physicality seems to be one of the trade-offs we make as a squad, whether it’s height and strength or pace.
It would be interesting to compare players pace and acceleration.
I had a quick look at the stats I could find and obviously Maeda and Juranovic are quick, McGregor looked like he was up there but Jenz was at the top.
It would seem to be that the typical entry points for top speed at the higher levels is 32km/h with many elite players at around 34km/h.
I am guessing we have too many under the 32km/h mark but an analysis of us vs the CL teams we came up against would be illuminating.
Ryan where are you getting the player speed data from ? thanks
https://www.uefa.com/uefachampionsleague/clubs/50050/squad/
Not sure what Uefa use. Doesn’t help for SPL.