In the aftermath of the AZ Alkmaar first leg, Celtic’s home-grown full back, Ralston, continued his “local underdog comes good” narrative arc with a performance that included some notable interventions.
Bad Habits
On The Huddle Breakdown last week, recorded after the AZ game, (follow the link to listen, and please subscribe to the channel – the other guys are excellent!), I fell into a trap that I usually try and avoid.
Namely, I had, on the pod, stated roughly along the lines of how wonderful Ralston had been versus how awful Taylor (and Starfelt for that matter) had been.
This binary conclusion without recourse to studying the 90 minutes of performance data reminded me of one of the primary reasons I started Celtic By Numbers.
Binary Analysis
Despite what some may have you believe, when watching any Celtic match, I don’t have a spreadsheet open! I have the same rational/ irrational, emotional, excitable responses to what happens on the field as most others. The second or third watch is when the data is collected and calm reflection applied.
My take on watching the AZ Alkmaar tie was broadly:
- Ralston = last ditch intervention – wow, taking players on up the line, headers, challenges = brilliant
- Taylor = continually giving the ball away, losing it in his own third, too small, too slow = rubbish
Because, like all of us, I cannot process 100 actions x 22 players and remember all the contributions. When watching a match and thinking back on it you form your own Match of the Day highlights reel. And that becomes your reality.
I started Celtic By Numbers as, when studying my sons team, it became obvious this brand of analysis served virtually no benefit to anyone because you were remembering a tiny % of a performance and ignoring all the other stuff that didn’t involve e.g. goals or mistakes.
So, I started to capture all the players’ actions. Painstaking but doable.
Back to Ralston and Taylor.
Ralston and Taylor
Spoiler: I am not going to conclude Ralston had a poor game, because he did not. But it had many facets.
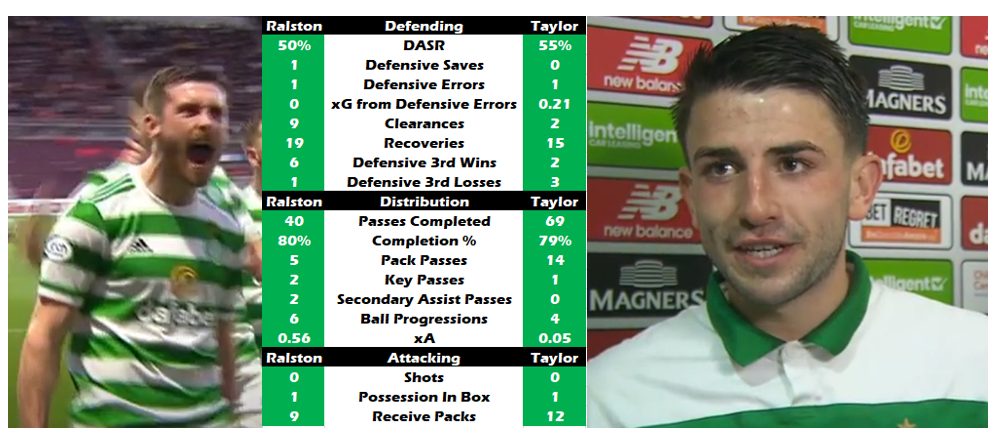
His Defensive Action Success rate was 50%, not terrible, but ”ok” for a full back (Taylor’s was 55%). But he was error free and cleared the ball 9 times, the most of any Celt.
Ralston had 1 key defensive save (the second half intercept) and 1 error (giving the ball away in a dangerous position in the second half), whilst Taylor had 1 error (giving the ball away in a dangerous position in the first half). These rare events have a huge bearing on perception.
He was 2nd in the team with 19 recoveries. Taylor managed 15.
He was also second (again to Welsh) with 6 occurrences of wining the ball back in his own defensive third. Taylor did that twice.
Ralston completed the least passes of any defender (40) and his pass success rate was 80%, 1% “better” than Taylor who “continually gave the ball away”. Taylor completed 52 passes.
Ralston had 2 Key passes (passes that led to shots) whilst Taylor had 1.
But Ralston only completed 5 Pack Passes (forward passes taking opponents out the game) – the lowest of the defenders by 7. Taylor had 14 – the joint most with McGregor.
Ralston excelled with 6 progressive runs, the most in the team. Taylor had 0.
Neither had a shot at goal but both received forward passes that took out opponents – Ralston 9 times and Taylor 12.
In the end, Ralston’s xSC (expected scoring contribution) was 0.56 compared to 0.05 for Taylor.
But Taylor had the highest packing score in the team at 117 – 20 more than McGregor and 28 more than Ralston.
Ralston was also booked.
Summary Data

Performance Summary
Ralston’s performance was by any measure very good. But it stood out because of moments. The goal saving intervention, the runs into the box to hit the by line. His “moments” tended to be positive.
Taylor’s “moments”, the ones you keep in your internal Match of the Day reel, were negative. Giving the ball away under no pressure, losing challenges in his own defensive third.
These were all seconds of a 90-minute performance. In the second half, Ralston completed 6 open play passes and gave 6 away. Yet Taylor was 18/7 and much more involved.
Taylor’s “rest of his performance” meant he was the Celtic player who most drove Celtic up the field either through passing or receiving forward passes. He had the highest Usage Rate of any player – 14% – meaning 14% of all on field actions for Celtic players were with him.
That wasn’t the conclusion I formed on first watch and communicated on the pod.
Which is why I wanted to catch myself on, but also hopefully provide an insight into why ALL the data points matter to some extent and that ALL performances have nuance that we (I mean “I”) often overlook.
Thanks for your continued analysis.
Is there a way of grading goal scoring opportunities created? For me Kyogo is so amazing because he keeps getting into 1 on 1 positions because of his movement and speed allowing 1 touch finishes (which was always said to be impossible at Celtic because of playing against packed defenses) where a typical Edouard chance involves 25 touches, trying to beat 3 players and get his shot away which generally results in losing possession with the odd shot and fewer goals, although he’s had a couple of good tap ins already this season.
Also stats on type of shot that has success. Turnbull is great at hitting the target from range because he keeps it down where people were miffed with Christie last season because he was trying to hit the top corner, a much smaller margin for error, and generally ballooned it over the bar (I think most of the goals he did score was when he hit low shots rather than his favoured 8 iron!)
Stating the obvious – but comparing Kyogo’s to Edouard and Turbull with Christie I don’t think it’s applied – there is value in learning how to get into higher goal scoring potential positions and also the type of shot that is more likely to result in a goal and incorporate these into training.
Thanks again and keep up the good work!
Hi Kenny – yes xA or Expected Assists – it is an indicator if the quality of the chance created.
I do agree on the bias of opinion that exists with Taylor. I personally think he is a very tidy player, has good composure on the ball and understands the position well.
With attacking LB being such an important role I do think his inadequacy in driving past players, delivery and the assists is where my frustration lies. In a team of celtics quality in the league we are in I woukd expect our Fullbacks to be posting numbers like those across the city or at klopps Liverpool.
Hi and thanks. Agree when Celtic have full backs suitable for this system (and Ralston and Taylor are performing manfully) then it will be even more relentless in terms of attacking play.
We like to have our minority views confirmed by hard evidence so it is nice for me to see evidence supporting my occasionally expressed view about Taylor and Starfelt not being as bad as many think .
Expected scoring contribution 0.05.
Is is not the case that teams allow him to get on the ball hence his high packing numbers, particularly his received pack passes due to the fact they know he can’t hurt them.
For me its similar to when teams used to allow Boyata to bring the ball out from the back. They would get tight and press others and leave the weakest player spare to get on the ball.
Thanks Ryan
I think teams do deploy that but i wouldn;t make that conclusion on 1 game. Last season Taylors xA (Expected assist) was 0.34 per 90m – one of the highest in the squad. This season it is 0.25 the highest of all the defenders.
Hi Alan
Do you not think you’re missing something with the pass completion %? It felt to me that Taylor was losing the ball in positions that were a lot more dangerous.
Also if Ralston is making a lot more clearances than Taylor and their pass completion % is similar, doesn’t that reflect badly on Taylor?
Hi and thanks for replying
Taylor’s is a mix of missing passes under little pressure which i THINK he does more against better teams, and because he does attempt creative more difficult passes. I have a “final 3rd loss” metric and also a “crosses success / failed” metric. It is a case of building a narrative across a number of data points.
Clearances are neutral in my view. On the one hand it indicates being under pressure and “kick it anywhere” on the other it can be no nonsense simple defending. EG Tierney always had a lot of clearances relative to his peers due to imo his simple approach to defending, which is a compliment.